Aviation Safety Project
A Python data pipeline that processes simulated aeronautical incident records, applies transformations and normalizations with Pandas, exports results via OpenPyXL, and generates visualizations in Power BI.
The Pipeline
I deliberately separated the data generation, processing, and presentation stages into distinct layers. Each pipeline stage is independent — making each part easier to test, maintain, and evolve.
Visualizations
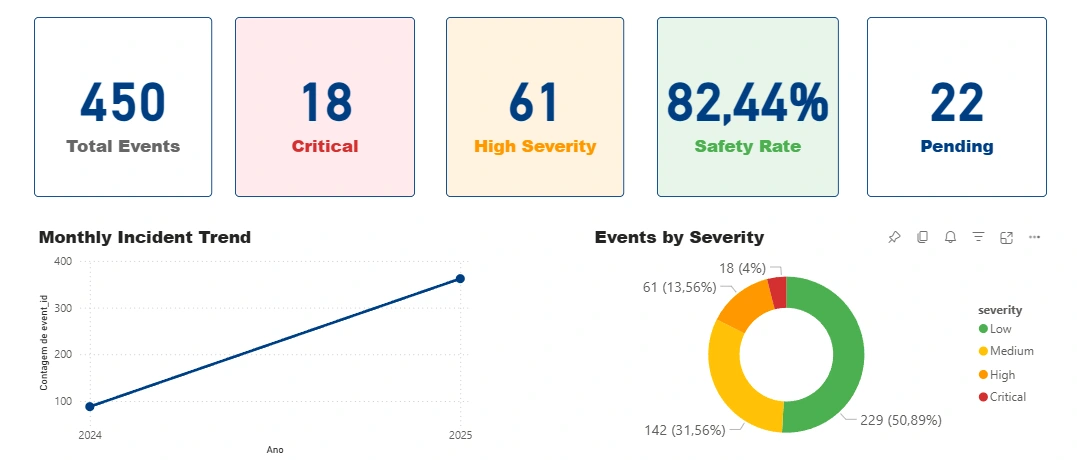
The processed data feeds a Power BI dashboard with metrics on the frequency, type, and severity of simulated incidents. The goal was to practice communicating data clearly to a non-technical audience.